Saturday, May 2, 2015

What is the difference between docker and Lxc?

From the launch of docker Top cloud service providers launched their container services for enterprises.


But few of them are still hang out with basic questions like What is docker, difference between docker and LXC, docker and VM.

So in this post we explore the actual differences between docker and LXC.

Docker is not a replacement for lxc. "lxc" refers to capabilities of the linux kernel (specifically namespaces and control groups) which allow sandboxing processes from one another, and controlling their resource allocations.
lxc vs docker


On top of this low-level foundation of kernel features, Docker offers a high-level tool with several powerful functionalities:
  • Portable deployment across machines. Docker defines a format for bundling an application and all its dependencies into a single object which can be transferred to any docker-enabled machine, and executed there with the guarantee that the execution environment exposed to the application will be the same. Lxc implements process sandboxing, which is an important pre-requisite for portable deployment, but that alone is not enough for portable deployment. If you sent me a copy of your application installed in a custom lxc configuration, it would almost certainly not run on my machine the way it does on yours, because it is tied to your machine's specific configuration: networking, storage, logging, distro, etc. Docker defines an abstraction for these machine-specific settings, so that the exact same docker container can run - unchanged - on many different machines, with many different configurations.
  • Application-centric. Docker is optimized for the deployment of applications, as opposed to machines. This is reflected in its API, user interface, design philosophy and documentation. By contrast, the lxc helper scripts focus on containers as lightweight machines - basically servers that boot faster and need less ram. We think there's more to containers than just that.
  • Automatic build. Docker includes a tool for developers to automatically assemble a container from their source code, with full control over application dependencies, build tools, packaging etc. They are free to use make, maven, chef, puppet, salt, debian packages, rpms, source tarballs, or any combination of the above, regardless of the configuration of the machines.
  • Versioning. Docker includes git-like capabilities for tracking successive versions of a container, inspecting the diff between versions, committing new versions, rolling back etc. The history also includes how a container was assembled and by whom, so you get full traceability from the production server all the way back to the upstream developer. Docker also implements incremental uploads and downloads, similar to "git pull", so new versions of a container can be transferred by only sending diffs.
  • Component re-use. Any container can be used as an "base image" to create more specialized components. This can be done manually or as part of an automated build. For example you can prepare the ideal python environment, and use it as a base for 10 different applications. Your ideal postgresql setup can be re-used for all your future projects. And so on.
  • Sharing. Docker has access to a public registry (https://registry.hub.docker.com/) where thousands of people have uploaded useful containers: anything from redis, couchdb, postgres to irc bouncers to rails app servers to hadoop to base images for various distros. The registry also includes an official "standard library" of useful containers maintained by the docker team. The registry itself is open-source, so anyone can deploy their own registry to store and transfer private containers, for internal server deployments for example.
  • Tool ecosystem. Docker defines an API for automating and customizing the creation and deployment of containers. There are a huge number of tools integrating with docker to extend its capabilities. PaaS-like deployment (Dokku, Deis, Flynn), multi-node orchestration (maestro, salt, mesos, openstack nova), management dashboards (docker-ui, openstack horizon, shipyard), configuration management (chef, puppet), continuous integration (jenkins, strider, travis), etc. Docker is rapidly establishing itself as the standard for container-based tooling.


Sunday, December 28, 2014

How to automate Large Scale log Parsing using Logstash?

Logstash is an application tool for Managing your events and logs. You can use it to collect logs, parse them, and store them for later use or real time Parsing using advanced Streaming Techniques.

In the current trend of Application Development and Automation Practices immediate action which are taken against customer data within a Short time span  or visualize their application current Status From Log data will benefit the customer to save their Pockets on vulnerable activities.

LogStash been bundled with many Open Source log Processor Features.  Application logs like Apache, Collectd , Ganglia and log4j etc. Other than this Logstash can also able to Process all types of  System logs, webserver logs, error logs, application logs and just about anything you can throw at it.

LogStash is Developed with Combination of Java and Ruby. Its an opensource you can vist the Logstash in below url

Github Url : - https://github.com/elasticsearch/logstash

LogStash been Mainly Falls under Four categories

1) Input

2) Codec

3) Filter

4) Output


Logstash Prerequisties:-

The only prerequisite required by Logstash is a Java runtime. It is recommended to run a recent version of Java in order to ensure the greatest success in running Logstash.

Download a latest version from

http://www.elasticsearch.org/overview/logstash/download/

wget https://download.elasticsearch.org/logstash/logstash/logstash-1.4.2.tar.gz

Untar the Logstash File

tar -zxvf  logstash-1.4.2.tar.gz

cd logstash-1.4.2/

Now run the Logstash by Command

bin/logstash -e 'input { stdin { } } output { stdout {} }' 

Now type something into your command prompt, and you will see it output by Logstash


Now we type:-

Hello OpenSourceCircle

The Output Screen shows:-

2014-12-02T15:12:23.490+0000 0.0.0.0 Hello OpenSourceCircle.

Here we ran logstash with stdin and stdout. So what text you are typing in command line shows as output below in Structured format.

Life of an Event :

Inputs, outputs, codecs and filters are the core concepts of logstash. 

Inputs:-

Inputs are the main mechanism for passing log data to logstash. 


  • file - read file from a file system. Like the output of tail commandn  in linux.
  • syslog - To parse syslog messages. 
     Popular Input Mechanisms are collectd, s3, redis, rabbitmq, etc.

Codecs:-

Codecs are stream operations for input and output data. It easily interpret the transport of your messages from the Serialization. Popular Codecs are json, multiline

Filters:-

Filters are used as on intermediate to act upon the Input data and take action with some conditions and filter the unimportant data.

  • grok - Grok Parse the arbitrary text and structure the data.
  • drop - drop an event completely ex: debug events
Outputs:-

Outputs are the last stage in LogStash Lifecycle. When the Output stage is completed the event been marked as executed.

  • csv
  • elasticsearch
  • json
  • http
  • cloudwatch
Now we can see the real time example of logstash using access logs of apache server. 

we can configure the logstash in localhost or webserver based on your need and use a conditional to process the events.

Create an file based on your wish, I name it the file as opensourcecircle-apache.conf

Paste the Below contents in conf file.

input {
  file {
    path => "/var/log/apache2/access_log"
    start_position => beginning
  }
}

filter {
  if [path] =~ "access" {
    mutate { replace => { "type" => "apache_access" } }
    grok {
      match => { "message" => "%{COMBINEDAPACHELOG}" }
    }
  }
  date {
    match => [ "timestamp" , "dd/MMM/yyyy:HH:mm:ss Z" ]
  }
}

output {
  stdout { codec => rubydebug }
}


Once you paste and save the file run logstash as bin/logstash -f opensourcecircle-apache.conf.

You Should able to see the output data in Command line.

We can also add Elasticsearch to save the log data by adding this configuration in output section by :-

elasticsearch { host => localhost  } 


Now the logstash open the configured apache access log file and start to process the events encountered. You can adjust the path of log file defined for apache access log.

Points to Note:-

1) The output lines been stashed with the type "field" set to "apache-access" (By the configuration line in filter as type "apache_access").

2) grok filter match the standard apache log format and split the data into separate fields.

3) Logstash not reprocess the events which were already encountered in the access log file and its able to save its positions in files and only process the new line when they are added.


Monday, November 17, 2014

What is Mean by Sharding?

Sharding is a type of database partitioning that separates very large databases into smaller, faster, more easily managed parts called data shards and can be spread across multiple servers. The word shard means a small part of a whole.

The concept of Database Sharding has been gaining popularity over the past several years, due to the enormous growth in transaction volume and size of business application databases. This is particularly true for many successful online service providers, Software as a Service (SaaS) companies, and social networking Web sites.


Database Size Grow Year By Year
The governing concept behind sharding is based on the idea that as the size of a database and the number of transactions per unit of time made on the database increase linearly, the response time for querying the database increases exponentially. 

Additionally, the costs of creating and maintaining a very large database in one place can increase exponentially because the database will require high-end computers. In contrast, data shards can be distributed across a number of much less expensive commodity servers. Data shards have comparatively little restriction as far as hardware and software requirements are concerned. 
Database Sharding Challenges:-
  • Reliability
  • Distributed queries
  • Avoidance of cross-shard joins
  • Auto-increment key management
  • Support for multiple Shard Schemes
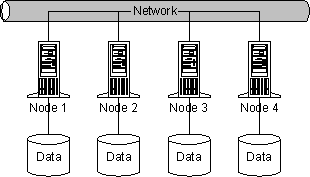
The basic concept of Database Sharding is very straightforward take a large database and divide into a number of smaller databases across servers. The concept is illustrated in the following diagram:


The reasons for the performance and scalability challenges are inherent to the fundamental design of the database management systems themselves.  Databases rely heavily on the primary three components of any computer:  CPU, memory and disk. 


Each of these elements on a single server can only scale to a given point-after that, you need to take additional measures to improve performance.  While it is common knowledge that disk I/O is the primary bottleneck, as database management systems have improved they also continue to take greater advantage of CPU and memory. 

Therefore, as business applications gain sophistication and continue to grow in demand, architects, developers and database administrators have been presented with a constant challenge of maintaining database performance for mission-critical systems.  This landscape drives the need for database sharding.

Historically, sharding a database required manually coding data distribution policies directly into your applications. Application developers would write code that stipulates directly where specific data should be placed and found.  In essence developers were creating work-around code to solve a database scalability problem so their applications could handle more users, more transactions and more data. 


In some cases, database sharding can be done fairly simply. One common example is splitting a customer database geographically. Customers located on the East Coast can be placed on one server, while customers on the West Coast can be placed on a second  server. Assuming there are no customers with multiple locations, the split is easy to maintain and build rules around.


Fig 2. Separate Database table based on each location

Using an example can help explain MySQL sharding more clearly, so let’s take the following table:


This is a small table containing a list of customers. Any modern database can handle such a table. But happens if instead the table has to store seven million rows instead of just seven rows?

Theoretically, this should not be a problem.  But usually there are lots of operations on such a large table – for example we may have many read and write operations on this table every second.In practice, a very large customer table can become a database bottleneck. Why? Because it doesn’t fit in the database server cache anymore, because of database isolation management, and for other reasons that cause the database to crawl under load.


How does sharding solve MySQL Scalability?

If we take the customers table, and split it into four different databases, each database will contain 1.80 million rows. That’s still a lot, but less than 8 million rows. This will result in improved database performance. In fact the following diagram shows how such a table can be split:

MySQL Data Distribution Database


Data distribution Database

Every database will get some of the rows. In old-fashioned do-it-yourself sharding, it was the developer’s responsibility to create an efficient, application-specific data distribution policy that efficiently stipulated exactly where each row should be stored and found for each table. Nowadays, that work is simplified and automated using Mysql Clustering.


Saturday, November 15, 2014

What is ElasticSearch?

Elasticsearch is a search server based on Lucene. It provides a distributed, multitenant-capable full-text search engine with a Restful web interface and schema-free JSON documents. Elasticsearch is developed in Java and is released as open source under the terms of the Apache License.

It provides scalable search, has near real-time search, and supports multitenancy. ElasticSearch is distributed, which means that indices can be divided into shards and each shard can have zero or more replicas. Each node hosts one or more shards, and acts as a coordinator to delegate operations to the correct shards. Rebalancing and routing are done automatically.

It uses Lucene and tries to make all features of it available through the JSON and Java API. It supports facetting, highlights, suggesters and percolating,  Percolating which can be useful for notifying if new documents match for registered queries.

Another feature is called "gateway" and handles the long term persistence of the index, for example, an index can be recovered from the gateway in a case of a server crash. Elasticsearch supports real-time GET requests, which makes it suitable as a NoSQL solution, but it lacks distributed transactions.

ElasticSearch can scale out to hundreds of servers and petabytes of data. 

Figure 1


Elasticsearch is much more than just Lucene and much more than “just” full text search. It is also:
A distributed real-time document store where every field is indexed and searchable. A distributed search engine with real-time analytics. Capable of scaling to hundreds of servers and petabytes(Figure -1) of structured and unstructured data .

ElasticSearch Requirements:-

Requirement for installing Elasticsearch is a recent version of Java. Preferably, you should install the latest version of the official Java from www.java.com.

You can download the latest version of Elasticsearch from elasticsearch.org/download.

curl -L -O http://download.elasticsearch.org/PATH/TO/VERSION.zip
unzip elasticsearch-$VERSION.zip
cd  elasticsearch-$VERSION

Elasticsearch is now ready to run. You can start it up in the foreground with:
./bin/elasticsearch

Add -d if you want to run it in the background as a daemon.
Test it out by opening another terminal window and running:
curl 'http://localhost:9200/?pretty'

You should see a response like this:
{
   "status": 200,
   "name": "Shrunken Bones",
   "version": {
      "number": "1.4.0",
      "lucene_version": "4.10"
   },
   "tagline": "You Know, for Search"
}

This means that your Elasticsearch cluster is up and running, and we can start experimenting with it.
You should change the default cluster.name to something appropriate to you, like your own name, to stop your nodes from trying to join another cluster on the same network with the same name!
You can do this by editing the elasticsearch.yml file in the config/ directory, then restarting Elasticsearch. When Elasticsearch is running in the foreground, you can stop it by pressing Ctrl-C, otherwise you can shut it down with the api

curl -XPOST 'http://localhost:9200/_shutdown'

Tuesday, September 23, 2014

How Amazon Web Services compete over Google Compute Engine

An article about pain points of AWS(Amazon Web Services) against GC(Google Cloud). So here comes the top 5 features that gives how AWS(Amazon Web Services) edge over GC(Google Cloud Computing)

These are the interesting features which will make the users prefer AWS(Amazon Web Services) as their work becomes easier and can find most of the solutions at one place.

1. Cloud Service

Amazon web services offers lot of features from hosted database (RDS) to CDN which makes the AWS a suitable option for customers running business on efficient.

Google Cloud has basic services from Host to NoSQL DB to Load Balancers to BigQuery and few others still in beta.

No wonder AWS offers very intensive monitoring metrics, Google Cloud still working on the advanced monitoring after acquiring stackdriver

Let see how google Implements Stack Driver.

2. Regions and Zones

Amazon Web Services have 8 regions and 30 zones across these regions.

At Present Google Cloud offers only 3 regions and 5 zones

3. Instance Types

Amazon Web Services is having variety of number of Instance types with combination of vCPU, RAM, Network, I/O etc. 
It supports around 30 instance types RAM ranging from : 0.6GB to 244GB and CPU ranging from : 1 vCPU to 32 vCPUs.
Amazon Web Services
In Google Cloud  it supports only 12 different instance types from : 

Ram :- 0.6GB to 52GB.
CPU ranging from : 1 vCPU to 8 vCPUs.

4. User Management and Permissions

Amazon Web Services allows creating users using LDAP directory user can be created without an email ID. 
By Using IAM (Identity and Access Management) a user can be restricted to certain resources and actions under Amazon Web Services.

Authentication and Authorization in Amazon Web Services 

1) Multi Factor Authentication using devices 
2) IAM and IDP using SAML
       
    List of  Supported Amazon Web Services Identity Providers

Google Cloud users need google account ID to access the resources and permissions cannot be set at resource level, only Owner/Edit/View can be assigned to users. 

5. Spot Instances & Reserved Instances

Amazon web Services offers 


1) Spot Instances
2) Reserved Instances
3) Dedicated Instances

Spot and Reserved Instances are the compute services offered by AWS where you can name the price for spot instances and reserve an instance which will run for long term and give you 50% cost savings

Google Compute Engine is yet to come out with such feature. Lets We hope to see the Feature in GC Soon with different Identity.

These are the major features of AWS which gives it a better position in the Public Cloud space when compared to the other cloud competitors who are now pitching in Public cloud like Google and Microsoft.

Aws trimmed the Supporting Cost 1/4 when compared to Google Cloud.

Supporting Cost (Business Support)

Amazon Web Services - Starts at 100$ per month
Google Cloud  - Starts at 400$ per month.

This Post has been Written after a detail analysis of Cloud Services with my colleague Victor Sundaram